Greenhouse Gas Inventory
The city’s greenhouse gas (GHG) inventory quantifies the GHG emissions resulting from activities taking place throughout Pleasanton by the community. The 2005 inventory creates an emissions baseline against which the City can set emissions reduction targets and measure future progress. The 2017 inventory is the most recent inventory completed for the City. The inventories provide an understanding of where GHG emissions are originating and allows the city to develop effective policies, strategies, and programs to reduce emissions.
2017 Inventory
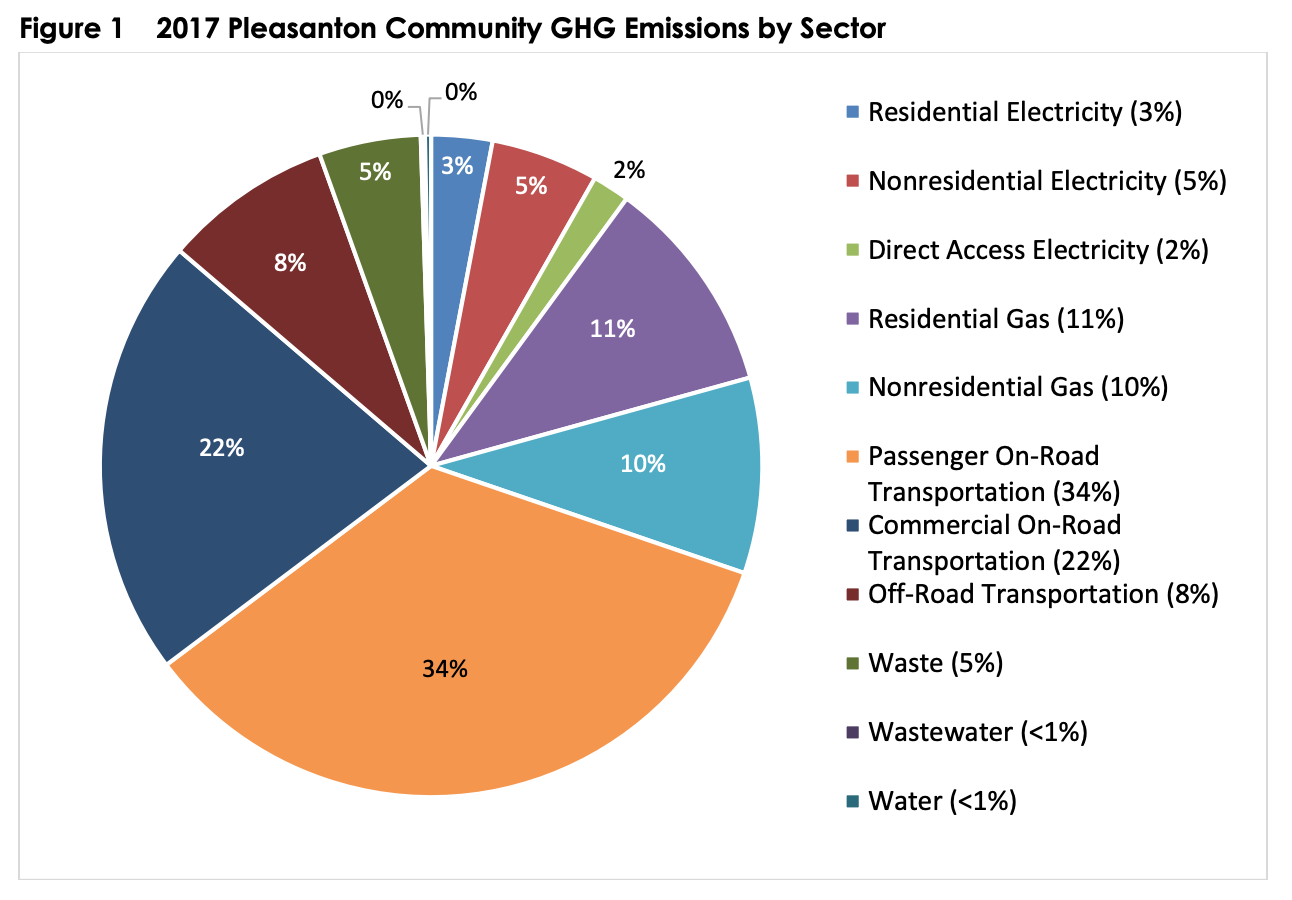
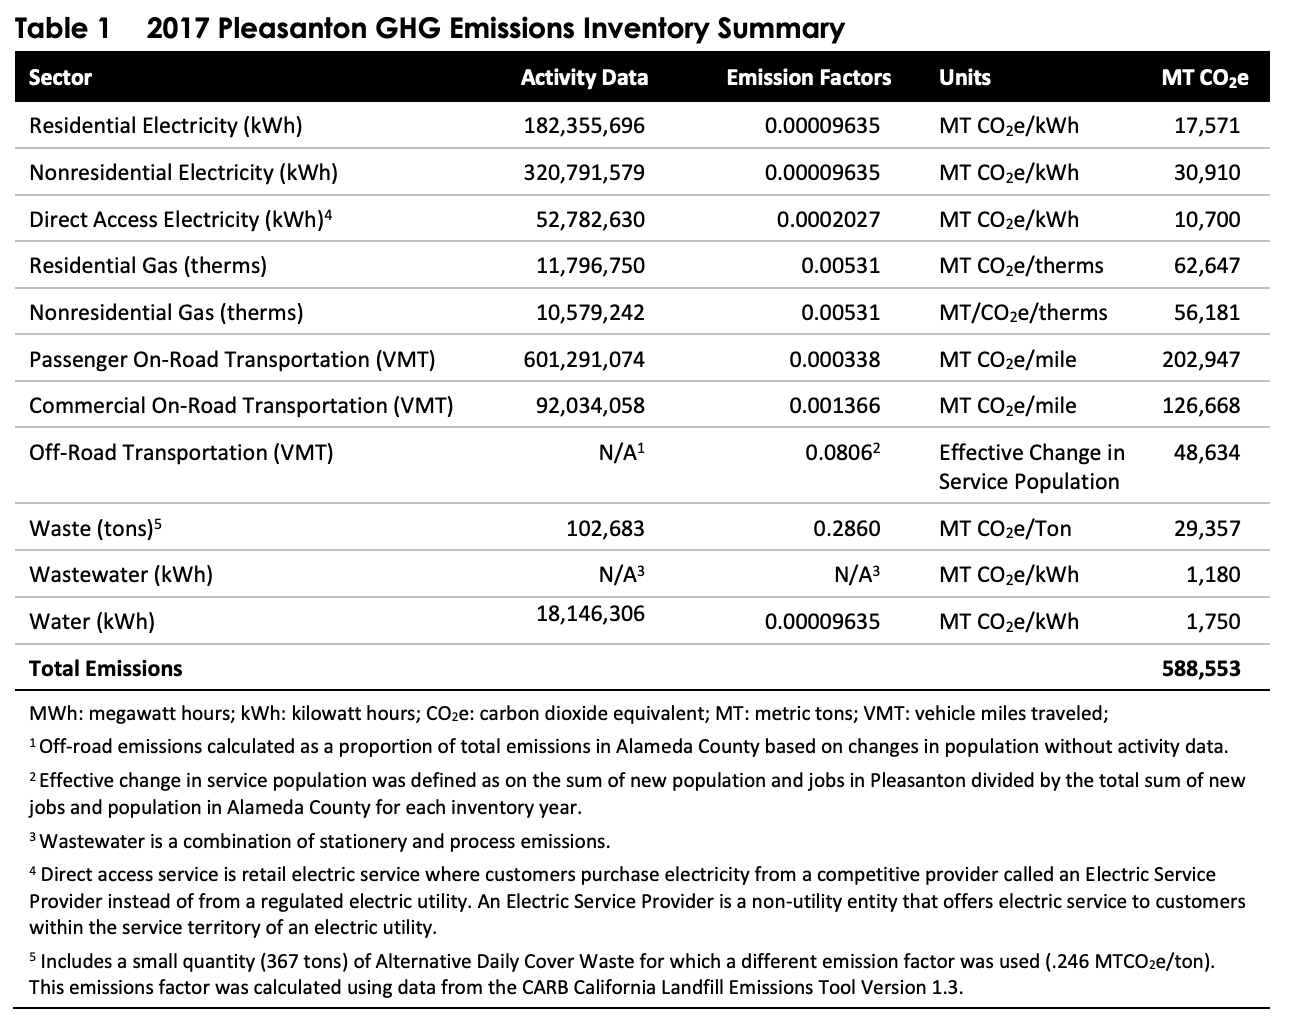
The 2017 greenhouse gas (GHG) emissions inventory is the most recent inventory completed by the City. It serves as the inventory to inform development of future GHG emissions forecasts that will assist the City in setting GHG emissions targets that are consistent with State-level goals and the Pleasanton General Plan 2005-2025. Emissions were estimated to be 588,553 metric tons (MT) of carbon dioxide equivalent (CO2e). Figure 1 and Table 1 below display the inventory results by sector.
2005 and 2017 Comparison
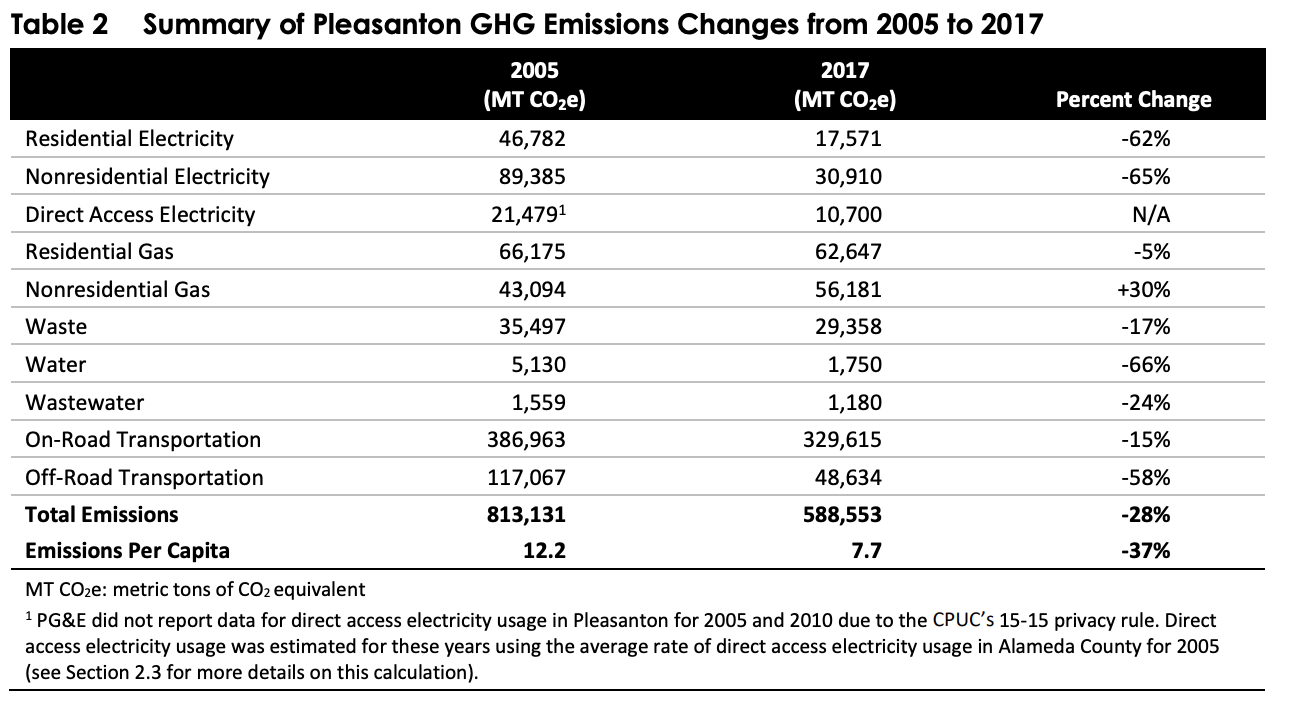
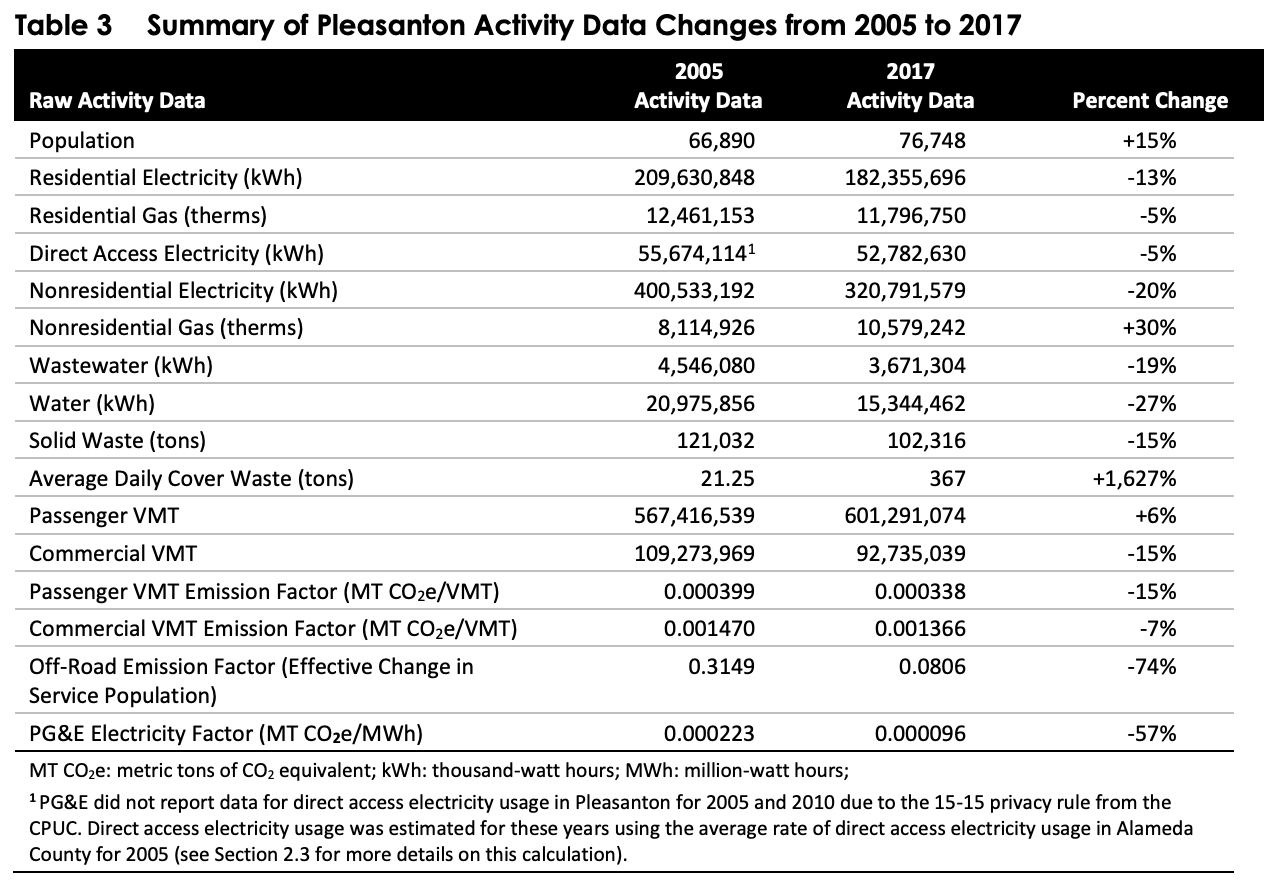
The City’s first inventory in 2005 serves as the baseline inventory with the 2017 inventory serving as the current inventory. Between 2005 and 2017, Pleasanton experienced a population increase of 15 percent but had a total emissions reduction of 28 percent. Pleasanton reduced GHG emissions in every sector except for nonresidential gas (which may have increased due to growth in development of the commercial and industrial sectors within the City). Table 2 summarizes GHG emission changes and Table 3 summarizes changes in activity data.
Emissions Forecasts- Business-As-Usual
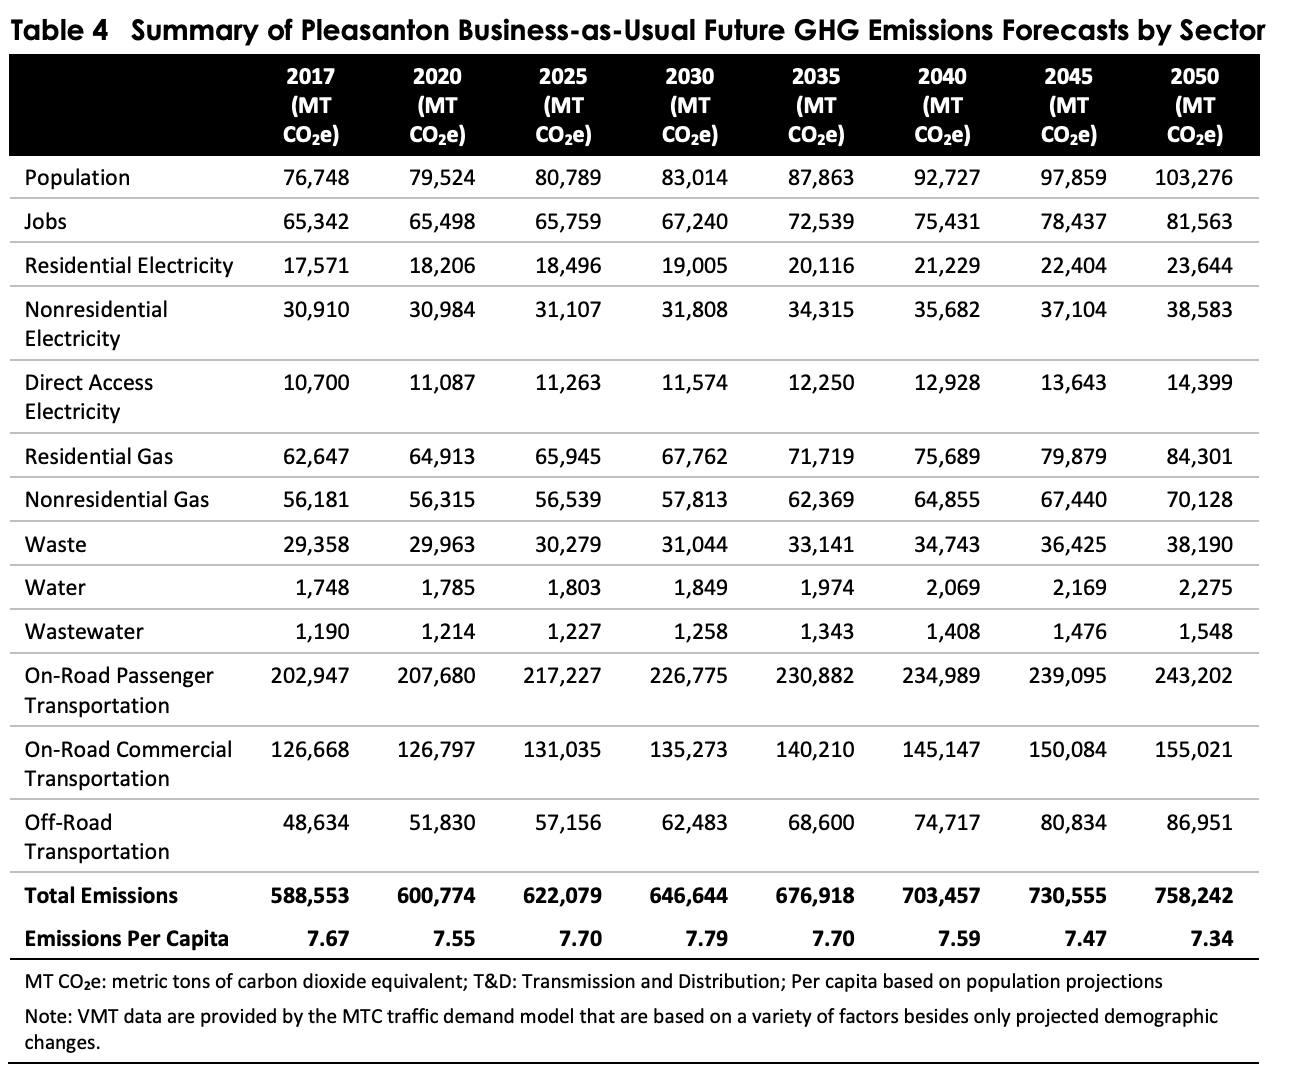
A business-as-usual (BAU) future GHG emissions forecast provides a forecast of how GHG emissions would change over time if consumption and activity trends were to continue as they did in 2017, and if growth were to occur as projected in the City’s 2005-2025 General Plan and Association of Bay Government’s future demographic forecasts. This does not include emission reductions from any regulations which would reduce local emissions. BAU forecast results for 2020, 2025, 2030, 2040, 2045, and 2050 are provided in Table 4.
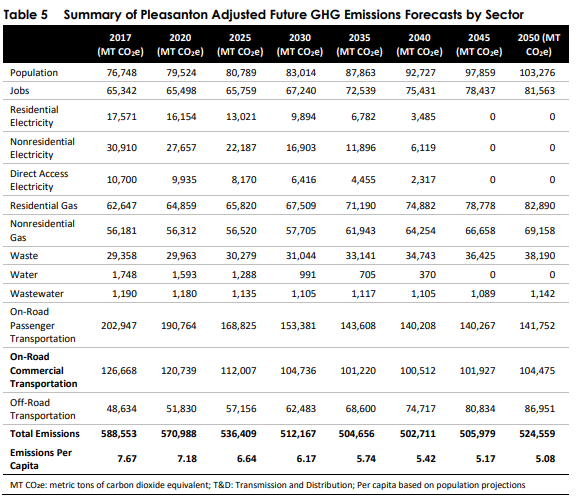
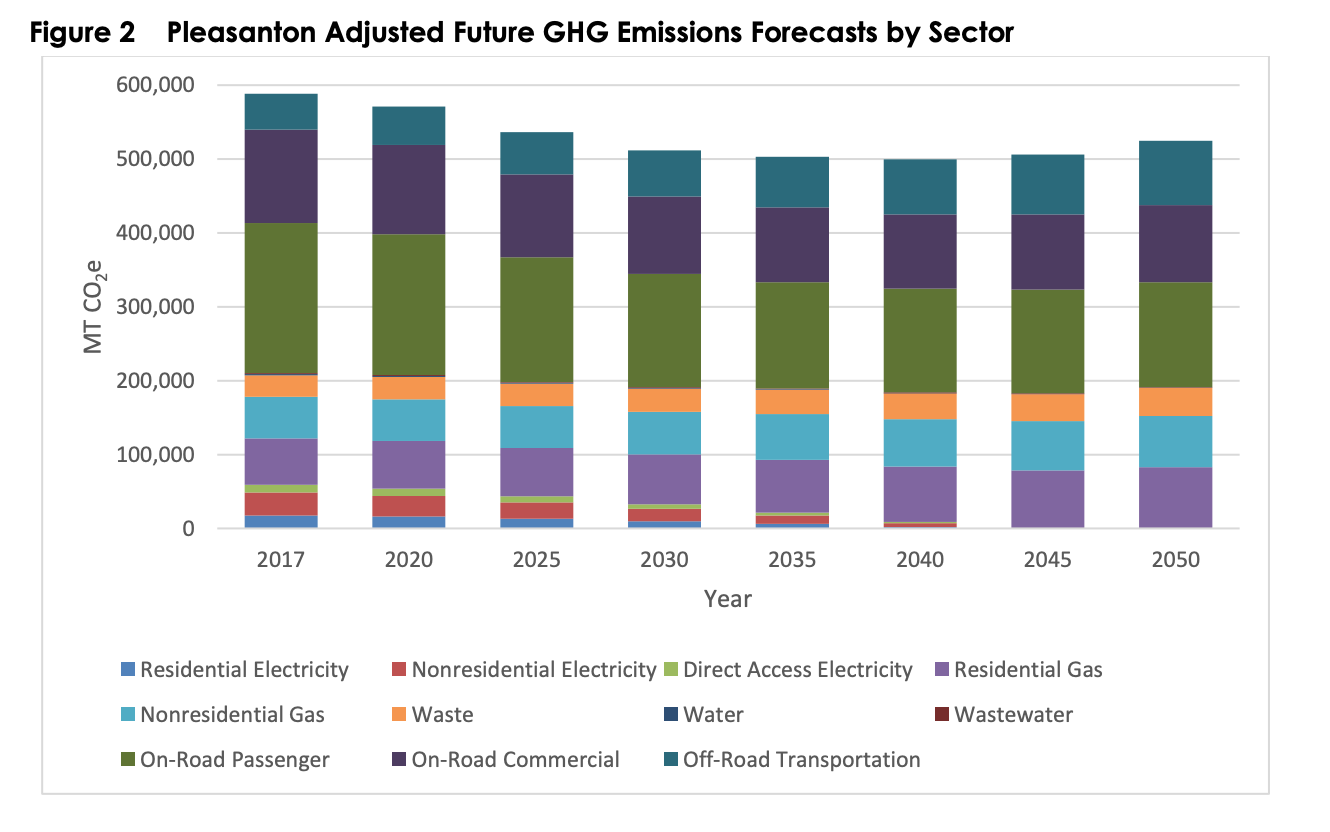
Emissions Forecasts- Adjusted
California has enacted multiple regulations that will reduce future local emissions. The impact of these regulations on GHG emissions have been incorporated into an adjusted forecast, which provides a more accurate picture of future emissions growth and the emission reduction the City and community will be responsible for after State regulations have been implemented. These State regulations include but are not limited to SB 100 (which sets a goal for reaching 100 percent electricity from renewable energy and zero-carbon sources by 2045) and California Air Resources Board (CARB) tailpipe emissions standards (Pavley Standards, Advanced Clean Cars Program). Calculating the difference between the adjusted forecast and the reduction targets set by the City determines the gap to be closed through City CAP policy implementation. The adjusted forecast is shown below in Table 5 and Figure 2.